
In the first two blogs in this series, we explored the impact of dissociated tumor and tissue cells (DTCs) on research and development, and the capability of dissociated samples to capture the full value of precious live tissue samples such as tumor resects. The historic problem with fresh tissue samples, as we saw in our first blog of this series, Dissociated Tumor Cells: The Key to Next-Generation Therapy, is that there is a tightly constrained time window in which samples must be used, and this time constraint places severe restrictions on the value that can be derived from a fresh sample. Processing fresh tissue samples into DTCs solves this problem. DTCs can be separated into multiple aliquots and cryogenically stored for extended periods in the vapor phase of liquid nitrogen. Having multiple identical aliquots and no time constraints means that DTCs can be extensively characterized to enable researchers to pick the exact attributes they want in a set of samples, thereby maximizing the return of experimental data that can be derived from a single sample. In the final blog in this series, we showcase the value of DTCs and look at some of the trends and patterns that have emerged from the data after characterizing more than 4500 DTCs across multiple disease states.
Indication-specific trends observed using DTCs
In the process of building an extensive catalog of DTCs, Discovery Life Sciences has analyzed thousands of unique patient samples across 17 different oncology indications and identified indication-specific patterns. Using flow cytometry, profiles can be established for tumor cells and total immune cells within a DTC. The immune compartment can be further evaluated, and counts made of CD4+ T cells, CD8+ T cells, B cells, NK cells, monocytic cells, and granulocytic cells providing a detailed snapshot of the state and content of the tumor. This large-scale immunophenotyping analysis has enabled the identification of cancer-specific trends and patterns.
As an example, observations across different cancer indications show that tumor cell percentages are higher in DTCs generated from bladder, breast, colorectal, endometrial, melanoma, and ovarian cancer samples, while lower tumor cell percentages are present in head & neck, kidney, liver, and lung cancer samples, as shown in figure 1a. In addition to tumor cells, immune cells represent a major component of the tumor microenvironment, and the distribution of these cell types is observed to be the inverse of those for the tumor cells, as can be seen in figure 1b.
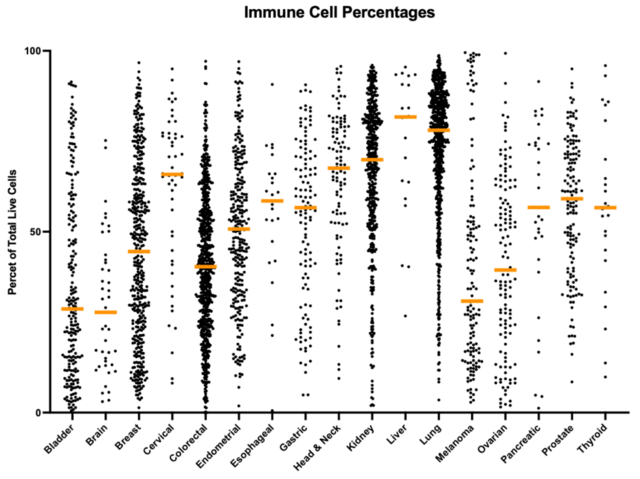
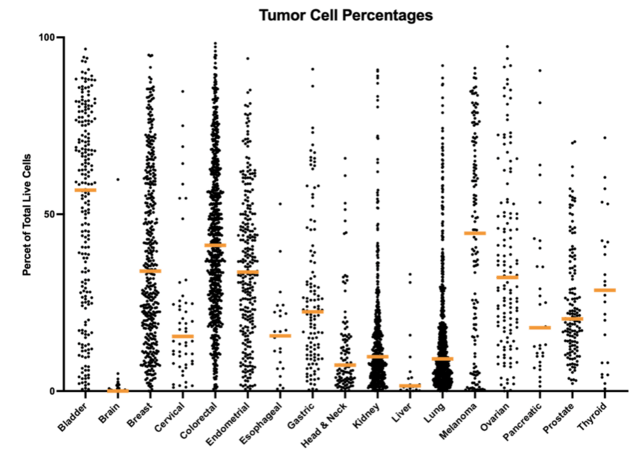
Figure 1. Differences in the percentage of tumor cells present for different types of cancer (1a). Differences in the percentage of immune cells present for different types of cancer (1b). It can be seen from this data that there is an inverse relationship between the distribution of the cell types. The highest immune cell percentages and lowest tumor cell percentages being observed in cervical, head & neck, kidney, liver, and lung specimens, while bladder, brain, and melanoma tumors have the lower immune cell percentages, and the higher tumor cell percentages.
This pattern is just one of the trends that emerges from the large-scale immunophenotyping performed in the generation of such large numbers of DTC samples across multiple indications. For a more detailed account of the trends and patterns observed across cancer types, you can download the Discovery DTCs User Guide from the Discovery Life Sciences website.
Immunomodulatory receptor expression in DTCs
The power of DTCs as a tool to increase our understanding of different disease states can be seen from an analysis of the expression of immune checkpoint inhibitors across different cancer indications. The recent success of checkpoint inhibitors such as Pembrolizumab, has led to increasing levels of research activity aimed at refining current immunotherapies and developing the next generation of therapeutics.
Checkpoint therapeutics work by binding the inhibitory receptors expressed on T-cells, or their ligands expressed on tumor cells. In so doing, these therapies seek to enhance T-cell mediated tumor cell killing by reducing or eliminating the ability of cancer cells to downmodulate the immune response. Several of the current therapies of this type, including Pembrolizumab,, target the inhibitor receptor PD1 on the surface of T-cells. However, not all cancers express the cognate ligands PDL1/PDL2 and hence are not affected by Pembrolizumab. Understanding the expression of the immune checkpoint ligands across indications is, therefore, key to determining which cancers can, and which cannot, be effectively treated using a given therapeutic. As a viable single-cell suspension of the entire tumor microenvironment, DTCs represent an excellent model system for the evaluation of immunomodulatory receptor expression and function.
The best-studied functions of PD1 have been elucidated on CD4+ and CD8+ T-cells. More recently, in addition to PD1+ T cells, tumor-infiltrating PD1+ B cells, and PD1+ NK cells have been described in the literature. In a study by Discovery Life Sciences, PD1+ B cells were found to be present in DTCs generated from all relevant indications, with the sole exception of kidney cancer, where PD1+ B cells were rare (figure 2). Also identified as part of the same study were two head and neck cancer samples where the percentage of PD1+ B cells approached the percentage observed in the T-cell compartment.
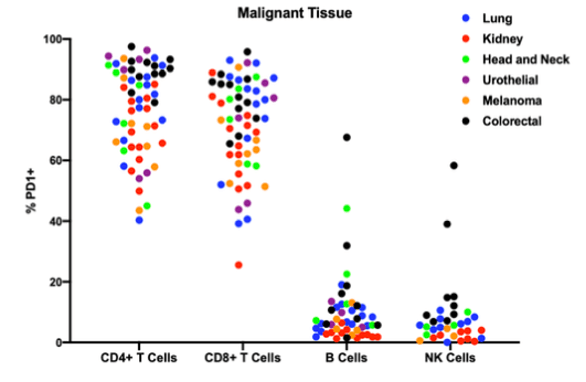
Figure 2. Percentage of each type of immune cells expressing PD1 by indication.
Similar to the patterns seen for B-cells, PD1+ NK cells were observed in colorectal cancer, lung cancer, and head and neck cancer. NK cells were rare in the urothelial cancer DTCs analyzed, while melanoma and kidney cancer DTCs had very low percentages of PD1+ NK cells. This work demonstrates that all major lymphocyte subsets present in the tumor microenvironment can express PD1 and could be influenced by checkpoint inhibitor therapy. This data suggests that the mode of action of anti PD1/PDL1 therapeutics may be more subtle and more complex than simply acting on CD4+ and CD8+ T-cells.
These examples are only the tip of the iceberg in terms of the patterns and trends that Discovery Life Science has identified in the analyses of thousands of DTC samples across multiple cancer types. It does, however, clearly demonstrate the power of DTCs as a tool to understand the detailed mechanisms of action of different therapeutically important pathways across and within different types of cancer, as well as the role DTCs have to play in the development of the next generation of immunotherapeutic interventions.
For a more extensive insight into the observed patterns and trends please see the Discovery DTC User Guide available on the Discovery Life Sciences website. You can find the first blog and the second blog in this series on the Discovery blog.
References
- Discovery DTCs User Guide, a comprehensive guide to best practice in DTCs. 2022. Discovery Life Sciences. [online] Available at https://www.dls.com/resources/dtcs-user-guide/ [Accessed 15 April 2022]